Oracle
Helping business stakeholders by creating data visualizations that prioritize clarity, simplicity, and accessibility, enabling them to quickly identify trends, patterns, and relationships within the data. Key principles involve selecting suitable color schemes, balancing visual appeal with functionality, and avoiding unnecessary embellishments or misleading elements.

DATA VISUALIZATION
ENTERPRISE, B2B
PRINCIPAL DESIGNER
01 . The Challenge
The challenges of data visualization include ensuring clarity and accuracy while avoiding distortion of the data. Common issues involve selecting the right visual format, managing large or complex datasets, and making visualizations accessible to diverse audiences.
Designers must also balance aesthetics with functionality, ensuring visuals are not overly complex or misleading. Additionally, choosing appropriate color schemes, avoiding clutter, and maintaining simplicity without sacrificing insight are ongoing challenges in creating effective data visualizations.
02 . The Solution
Helping business stakeholders by creating data visualizations that prioritize clarity, simplicity, and accessibility, enabling them to quickly identify trends, patterns, and relationships within the data. Key principles involve selecting suitable color schemes, balancing visual appeal with functionality, and avoiding unnecessary embellishments or misleading elements.
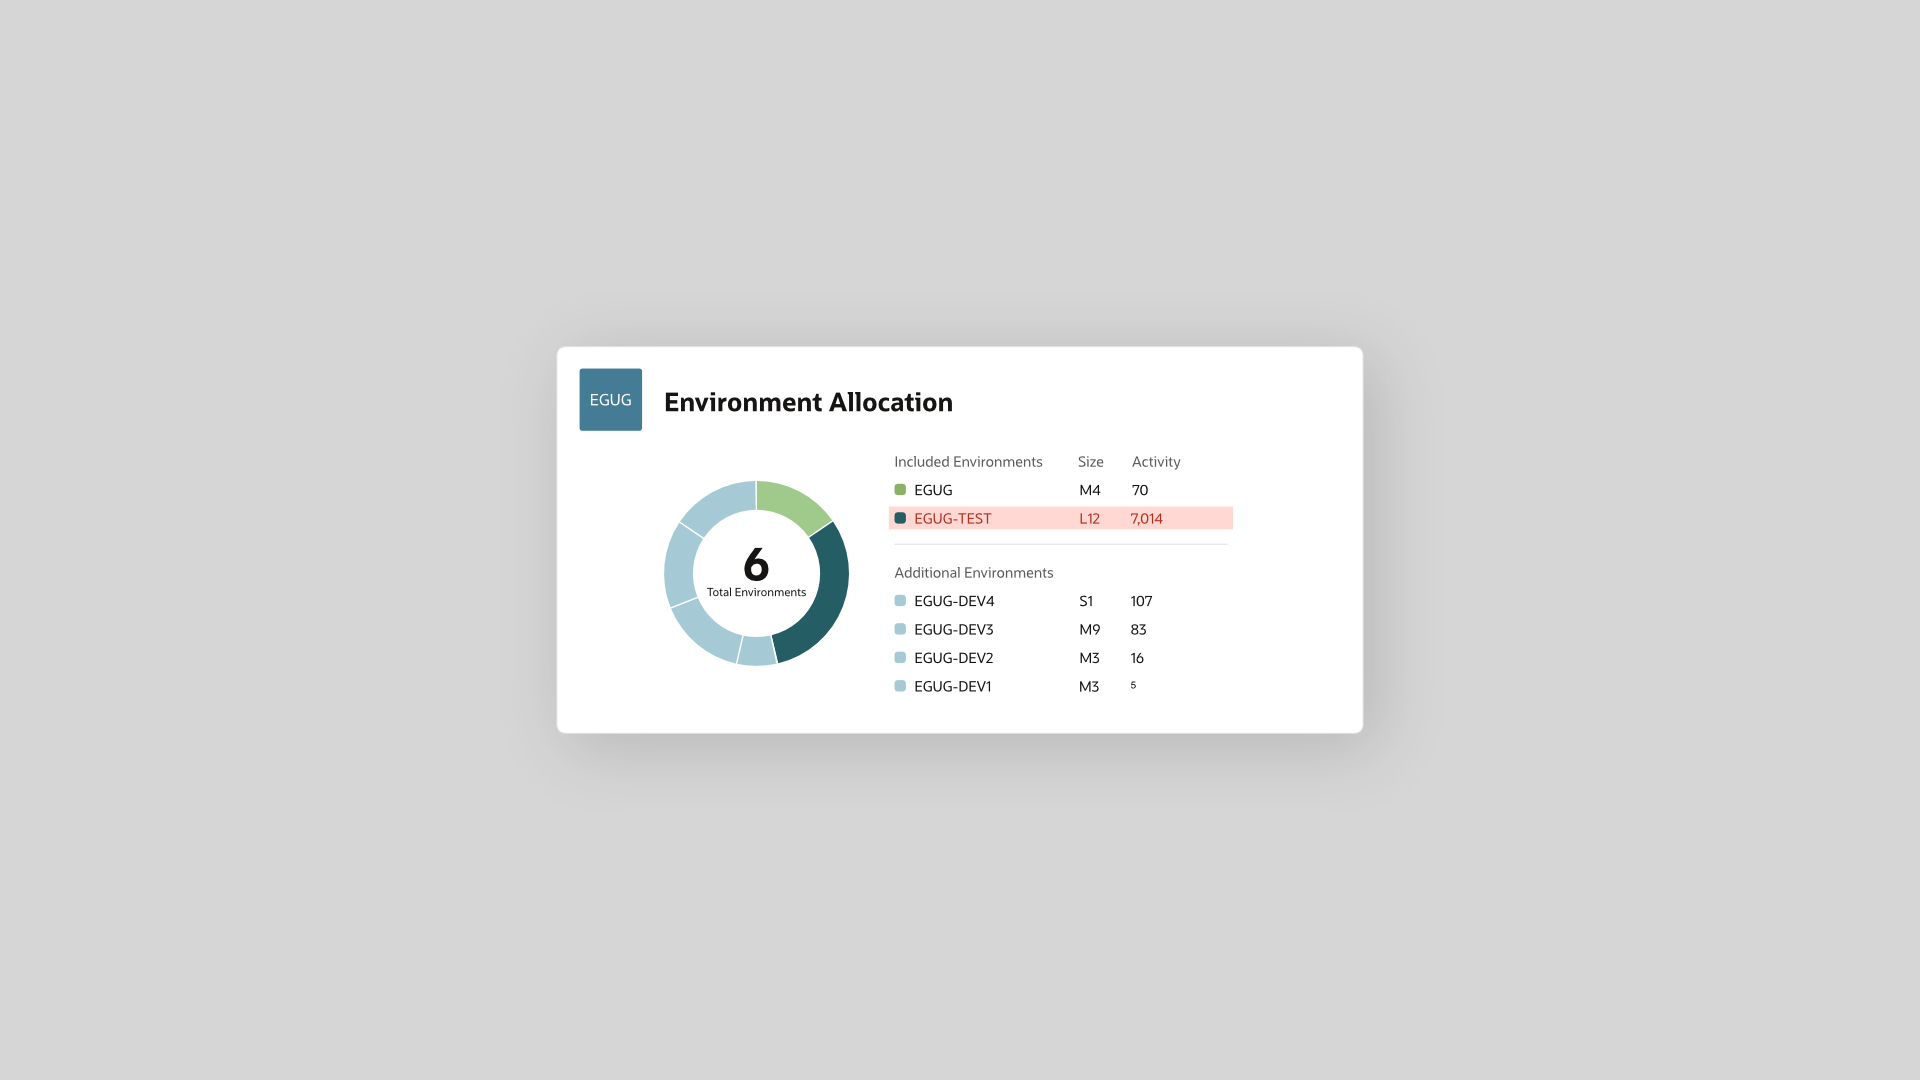
Environment Allocation
The card displays the effectiveness of the customer's subscription environments. In this case, the 'TEST' environment is currently under utilized.

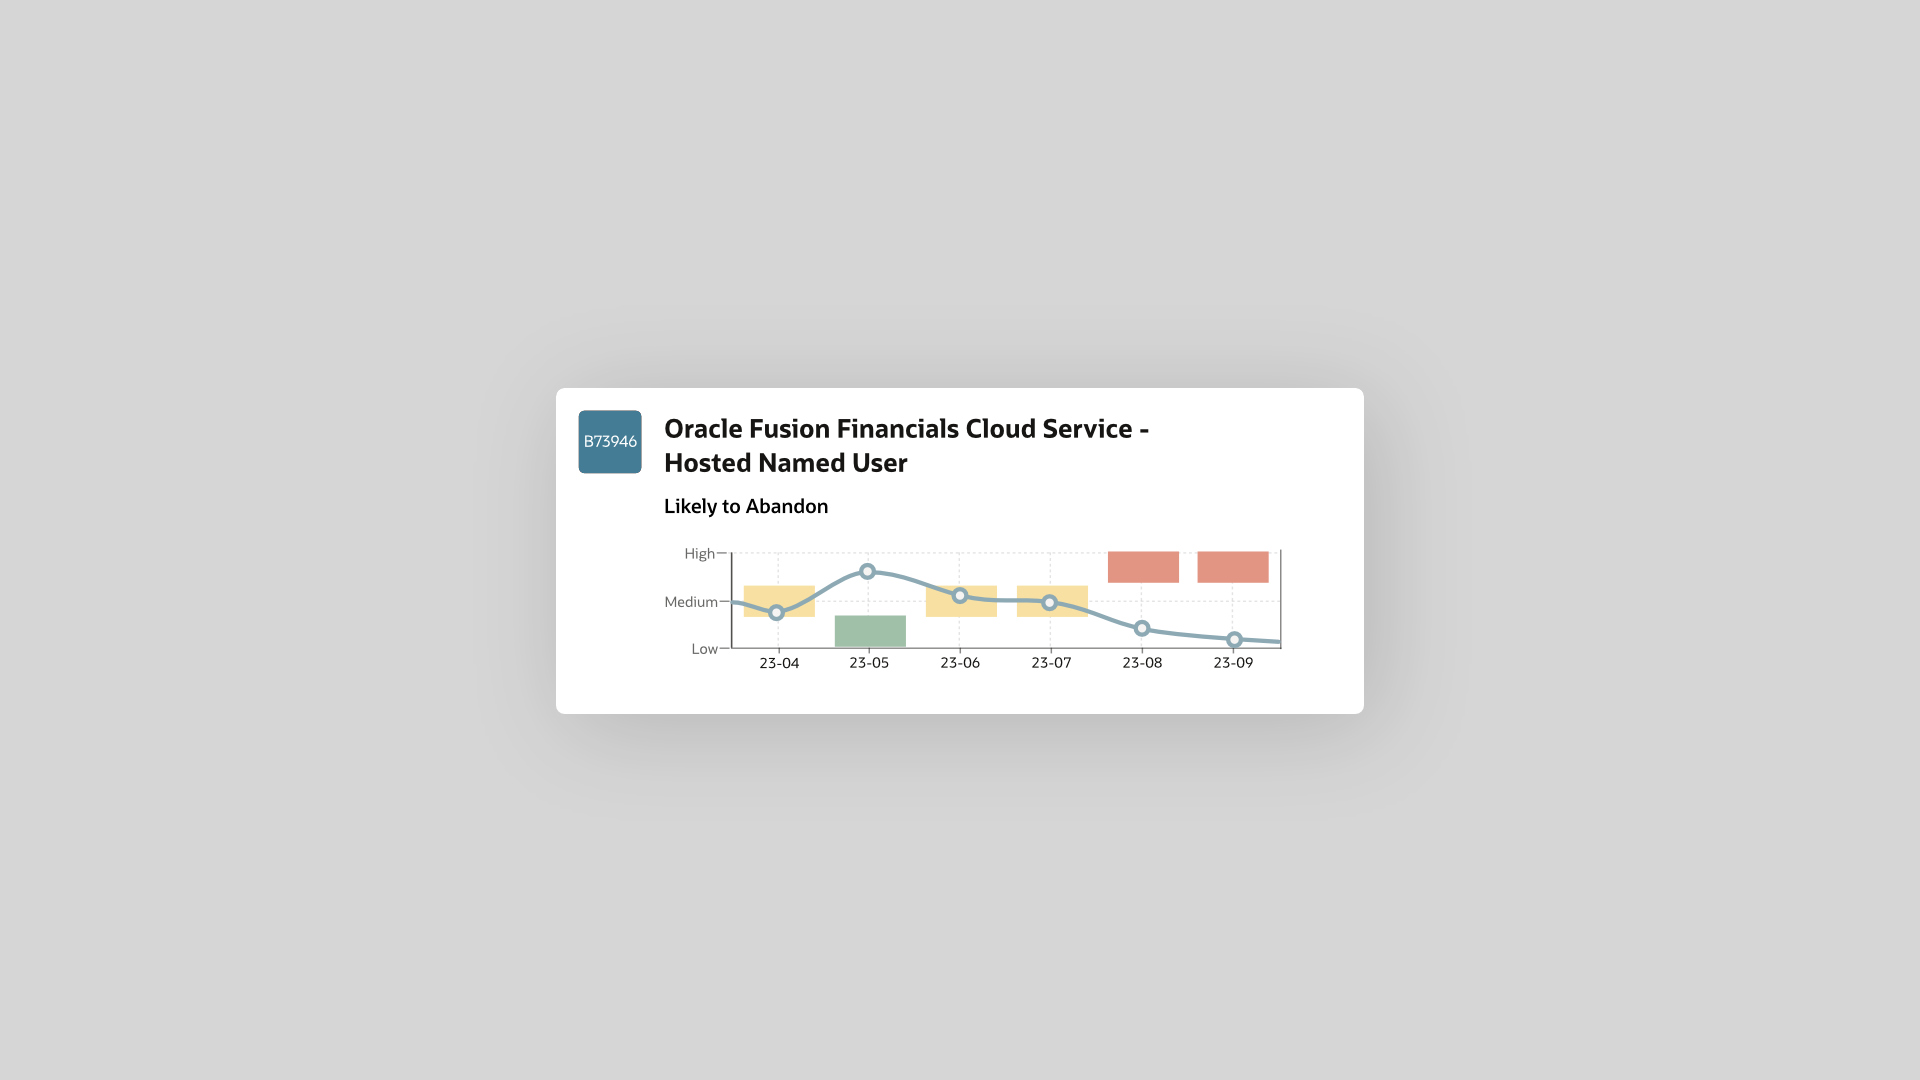
Likely to Abandon
The purpose is the display the monthly likelihood of a customer canceling their subscription, based on tracked activity.

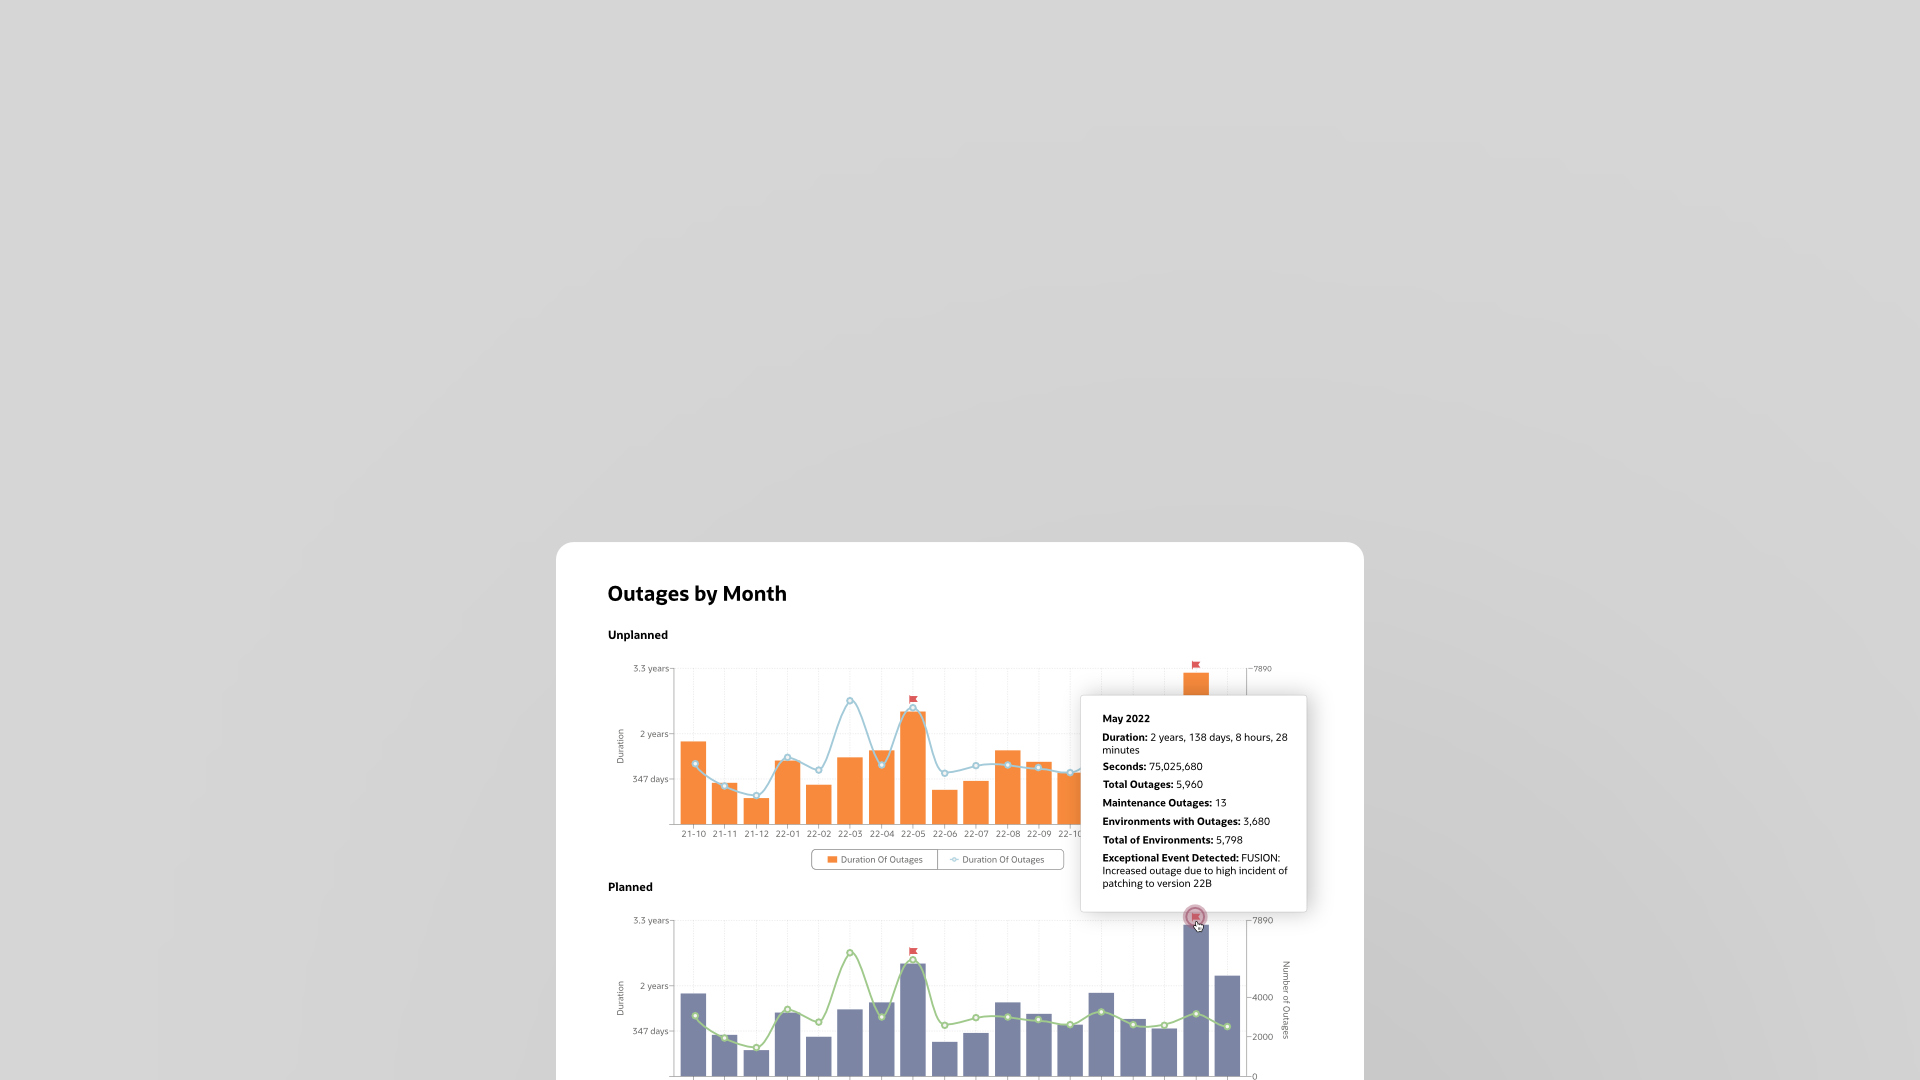
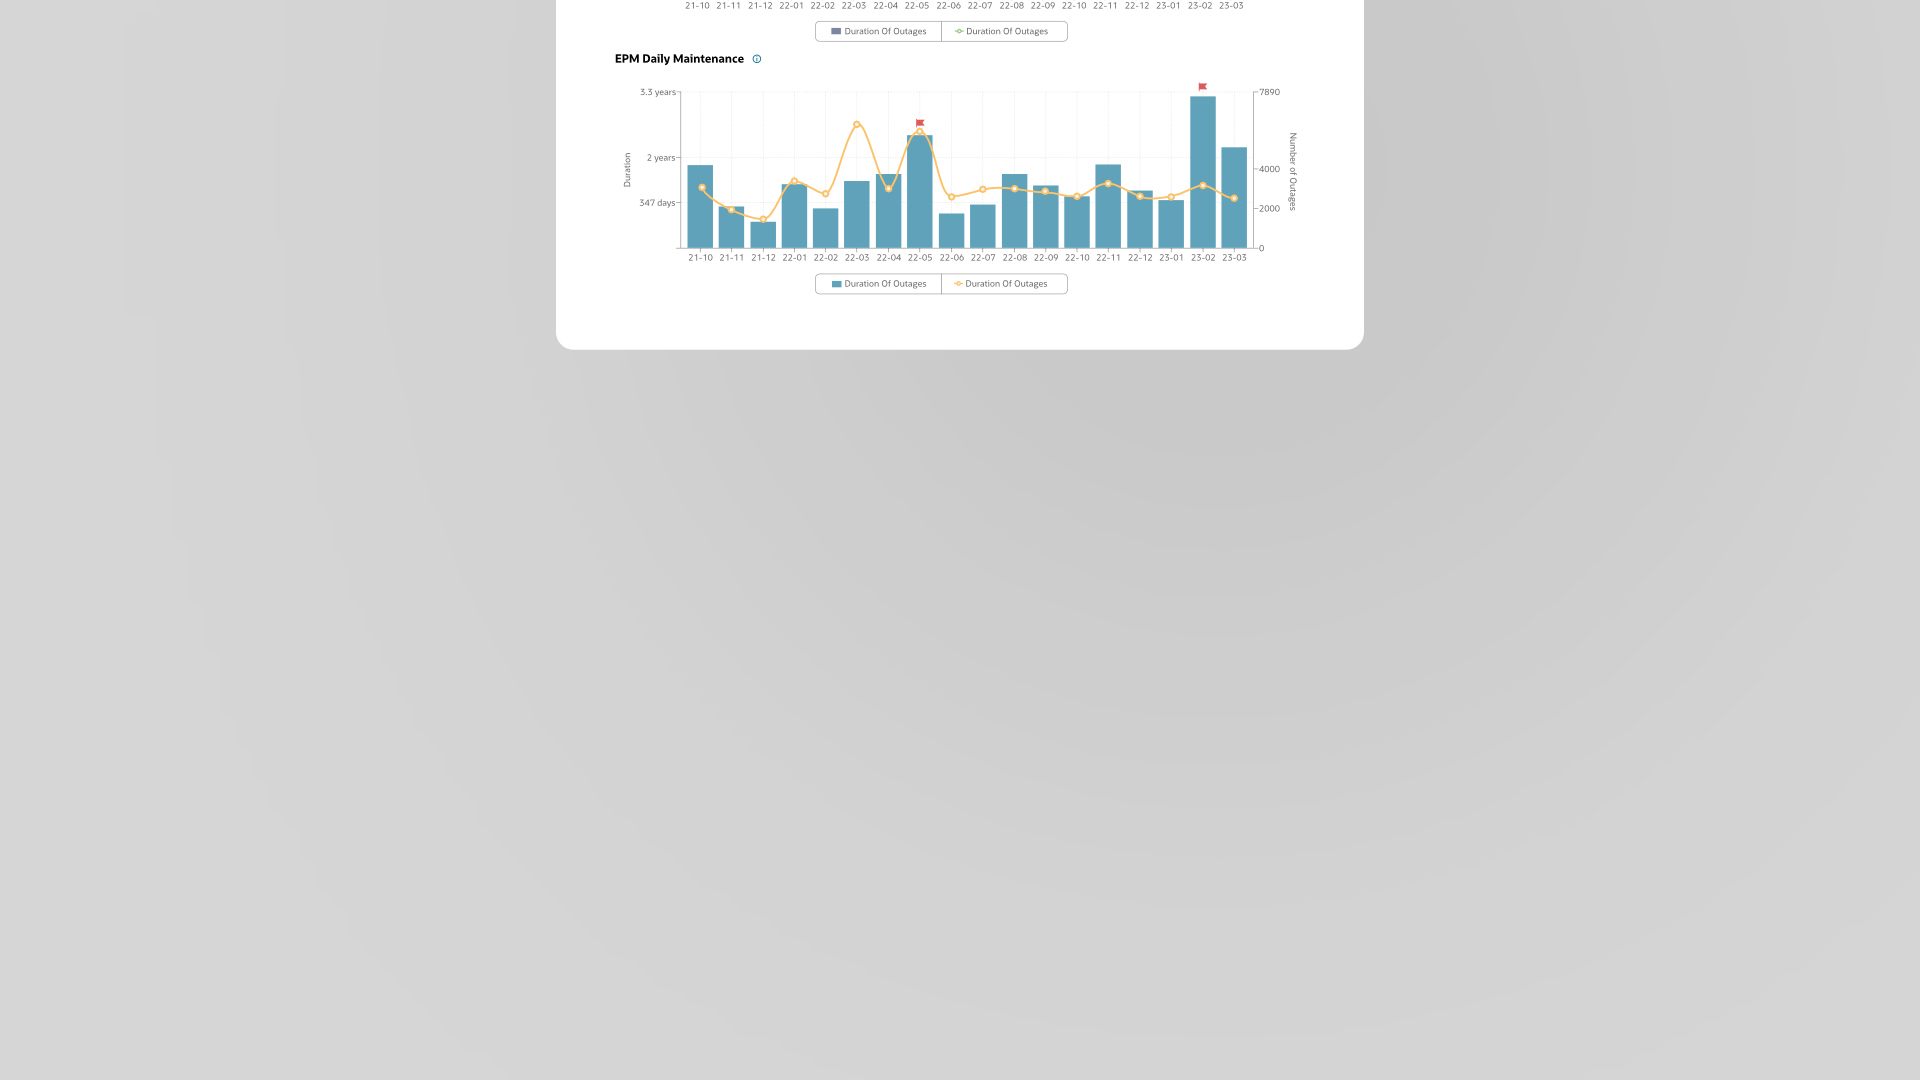
Outages
The graph displays three types of outages, with built-in warning flags to highlight problems and enable users to access more detailed information. It offers flexibility in viewing data for the entire fleet, specific regions, or individual pillars.

